• 21.08.2025, 22:39
  • S’inscrire
  • Connexion
  • Vous n’êtes pas connecté.


InfoSeeker

Senior Member

Data Log question

jeudi 14 mai 2015, 00:48

Well, this is embarrassing, but I need help find the entry point to create a Data Log. The manual states:

Citation

10.1. Log settings
The log settings can be accessed by clicking the “Log settings” element below
the “Data log” headline in the listing.

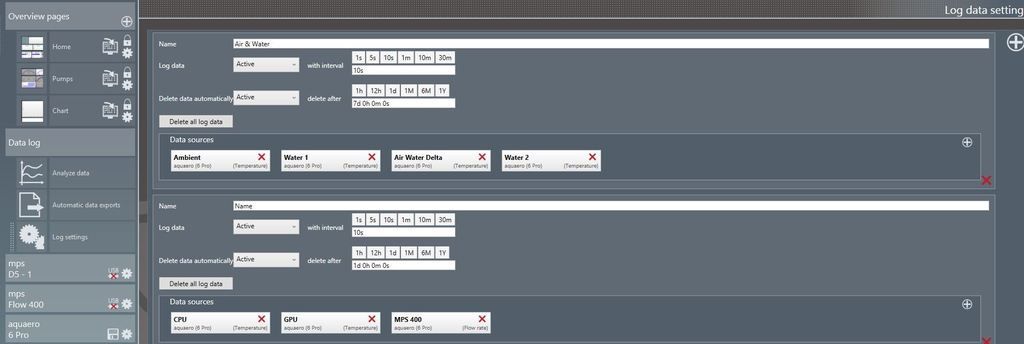
But the only "Data Log" I see is a tab under the aquaero in aquasuite, and it does not accurately reflect the options discussed in the manual.

Railgun

Full Member

jeudi 14 mai 2015, 11:27

You don't have this section in Aquasuite? It should be there and I'm not aware of any way to remove it, or add it if not there.

Ce message a été modifié 1 fois. Dernière modification effectuée par "Railgun" (14 mai 2015, 11:29)

Jakusonfire

Full Member

jeudi 14 mai 2015, 12:30

First go to log Settings and add some data sources that you want to use.


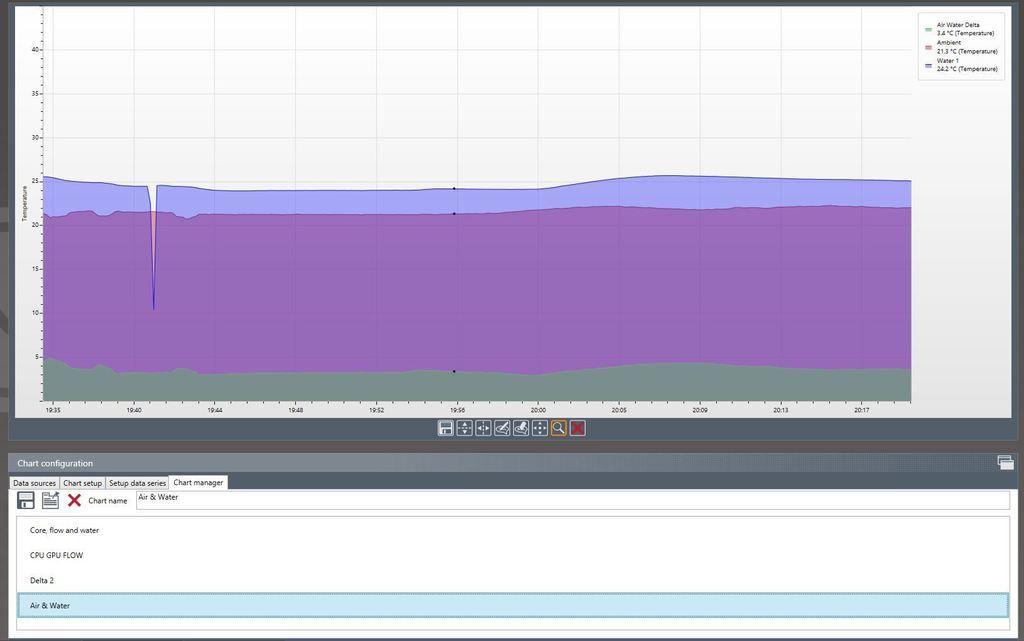
Add the Data Sources to a chart


Save the chart for use in an overview page

Ce message a été modifié 1 fois. Dernière modification effectuée par "Jakusonfire" (14 mai 2015, 12:32)

InfoSeeker

Senior Member

jeudi 14 mai 2015, 20:17

Wow, talk about Major Brain Fart... I got locked on the Data Log tab under the aquaero and didn't see the primary one I needed. I'll ask later what the aquaero Data Log is used for.

OK, I set up a data set, made the chart the way I wanted, saved the chart and am able to pick it up on the Display Page.


Only thing is, when I closed the edit function of the display page to set it on the desktop, the data log graph is not there.


I know it must be something simple, but am not able to determine my error.

Edit, by the by, thank you both very much for your help.

Ce message a été modifié 1 fois. Dernière modification effectuée par "InfoSeeker" (14 mai 2015, 20:19)

InfoSeeker

Senior Member

samedi 16 mai 2015, 15:13

Well, I re-installed aquasuite as repair, and that did not fix the issue, but a re-install as new did.

InfoSeeker

Senior Member

samedi 16 mai 2015, 23:06

OK, moving on... I am trying to have the Data Log display show 15 minutes of data to match the rest of the elements, but am able to show only a 30 minute window. Is this the only Time Frame available?


I set the Time Frame to 15m in the Data Sources tab of the Chart Configuration section to no avail.

InfoSeeker

Senior Member

dimanche 17 mai 2015, 04:05

mhmm, it appears one has to set the Time Range prior to adding the data to the chart... looks like it is not changeable once the chart is started.

Discussions similaires