 24.04.2024, 06:09
 Changer la langue
 S’inscrire
 Connexion
Vous n’êtes pas connecté.
Bonjour, visiteur, bienvenue sur les forums Aqua Computer Forum. Si c’est votre première visite, nous vous invitons à consulter l’Aide. Elle vous expliquera le fonctionnement de cette page. Pour avoir accès à toutes les fonctionnalités, vous devez vous inscrire. Pour cela, veuillez utiliser le formulaire d’enregistrement, ou bien lisez plus d’informations sur la procédure d’enregistrement. Si vous êtes déjà enregistré, veuillez vous connecter.

il faut bien expérimenter 
You can simply use a "water temp" - "ambient temp" sensor (with a low pass filter if it varies too much)
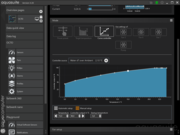
For the fan curve to avoid having your fan speed jump, just set a curve like that for example, and tweak the base, and maximum speed depending on the temperatures you want for the water :
And since you have a flow meter, you could have some fun and experiment with your pump speed depending on how your loop is set up.
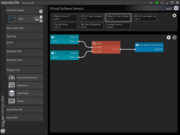
For this to work you would need a temperature sensor before, and after the rads, and have all the rads in series (no waterblock in between rads).
You can then measure the water temp difference between input and output of the radiators (in this example i made a virtual sensor of it).
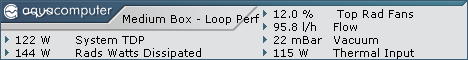
With water flow value, and knowing the specific heat of water, you can create a virtual sensor to calculate the heat really dissipated by the radiators, in watts.

You can then play with pump speed and see what it changes in terms of dissipation.All you'll see is spikes when the flow increase suddenly... then as water in and out temps stabilize after like 10 seconds... the dissipation is the same, no matter what flow.
.. and it's a nice sensor to have in the dashboard :p
In the end, for the pump speed, you'd just want to set it to 100% and look at your GPU temp under load.
as you lower the pump RPM, the GPU temp will climb extremely slowly.. like maybe 1 or 2° when you're down to 50% speed... keep going down and there's a moment you will see it increases a lot faster. In my case for example, if i go below 40% the temperature shoots up by 10° quickly. so that's my lowest speed.
From there, either keep the pump speed fixed, or set a curve that doesn't go below that threshold.
That's just how i set things up, you'll have to experiment a bit to find good values that keep things cool and/or silent as you like
You can simply use a "water temp" - "ambient temp" sensor (with a low pass filter if it varies too much)
For the fan curve to avoid having your fan speed jump, just set a curve like that for example, and tweak the base, and maximum speed depending on the temperatures you want for the water :
And since you have a flow meter, you could have some fun and experiment with your pump speed depending on how your loop is set up.
For this to work you would need a temperature sensor before, and after the rads, and have all the rads in series (no waterblock in between rads).
You can then measure the water temp difference between input and output of the radiators (in this example i made a virtual sensor of it).
With water flow value, and knowing the specific heat of water, you can create a virtual sensor to calculate the heat really dissipated by the radiators, in watts.
You can then play with pump speed and see what it changes in terms of dissipation.All you'll see is spikes when the flow increase suddenly... then as water in and out temps stabilize after like 10 seconds... the dissipation is the same, no matter what flow.
.. and it's a nice sensor to have in the dashboard :p
In the end, for the pump speed, you'd just want to set it to 100% and look at your GPU temp under load.
as you lower the pump RPM, the GPU temp will climb extremely slowly.. like maybe 1 or 2° when you're down to 50% speed... keep going down and there's a moment you will see it increases a lot faster. In my case for example, if i go below 40% the temperature shoots up by 10° quickly. so that's my lowest speed.
From there, either keep the pump speed fixed, or set a curve that doesn't go below that threshold.
That's just how i set things up, you'll have to experiment a bit to find good values that keep things cool and/or silent as you like
Ce message a été modifié 1 fois. Dernière modification effectuée par "Remayz" (19 juin 2021, 19:57)
J'avais une explication détaillée mais ce forum est trop pourri il a enregistré ... et laissé que la 1ere ligne ...
Bon la vitesse de la pompe joue bcp sur la température instantané à l'endroit du CPU notamment pour les AMD.
C'est intéressant de l'accélérer quand il est très utilisé.
Mais aussi de la ralentir quand il n'y en a pas besoin pour diminuer le bruit. Ce qui est très important dans un environnement silencieux comme la nuit chez moi.
C'est pas la meme courbe que pour les ventilos, mais elle est quand meme utile.
> "water temp" - "ambient temp"
Yes look at my graph i use one.
> You can then measure the water temp difference between input and output of the radiators
No, it's useless. The mean T° of the water is enough to drive the flow speed and fan speeds.
Ce message a été modifié 1 fois. Dernière modification effectuée par "softlion" (19 juin 2021, 18:57)
Si la pompe est bruyante, ouep, ca ne se discute pas ca dépend du modele, du montage, du boitier 
That sensor is just used for the dissipated power measurement in my example, not for fan driving (i could integrate it into the dissipated power formula, but i also need it for display in the dashboard, so i made two
.
Water temp, or water dT over ambient is sufficient, for fans yes.
ca dépend du modele, du montage, du boitier
> You can then measure the water temp difference between input and output of the radiators
No, it's useless. The mean T° of the water is enough to drive the flow speed and fan speeds.
That sensor is just used for the dissipated power measurement in my example, not for fan driving (i could integrate it into the dissipated power formula, but i also need it for display in the dashboard, so i made two
.
Water temp, or water dT over ambient is sufficient, for fans yes.
I accidentally updated to X39 yesterday and am also seeing auto-shutdowns throughout the day.
aquasuite logging activated (a-suite_set.jpg)
but nothing in folder (a-suite_logs.jpg)
Windows event log attached:
aquasuite logging activated (a-suite_set.jpg)
but nothing in folder (a-suite_logs.jpg)
Windows event log attached:

X.40 crash:
I did not test with gallons, nor with other flow sensors.
EDIT: I tested with a High Flow USB flow sensor and the results were the same as with the High Flow Next flow sensor.
- create a data log that includes a High Flow NEXT sensor with flow rate value in l/m (log_data.jpg)
- analyze data to create chart (analyze_data.jpg)
- add Log data chart in overview page, and select the Analyze data chart containing Flow @ l/m (display_data.jpg)
- boom
I did not test with gallons, nor with other flow sensors.
EDIT: I tested with a High Flow USB flow sensor and the results were the same as with the High Flow Next flow sensor.
Ce message a été modifié 1 fois. Dernière modification effectuée par "InfoSeeker" (28 juin 2021, 01:18)

I have just built a new system with High Flow Next and Octo. I managed to understand Aquasuite enough to create an overview page to monitor sensors and fans to help complete my setup. But now I need to look into my fan profiles - I'm trying to balance acoustics and temperatures on this system. My first attempt at creating a "live" chart of temperatures failed and I ended up copying and pasting one from the High Flow Next page. Which brings me to two questions:
1) Is there actually a comprehensive user manual for Aquasuite? What I have found so far is insufficient - in particular about creating a chart.
2) What I copied from the High Flow Next page does not appear to be something that I can create myself - is this true?
1) Is there actually a comprehensive user manual for Aquasuite? What I have found so far is insufficient - in particular about creating a chart.
2) What I copied from the High Flow Next page does not appear to be something that I can create myself - is this true?
Some widgets are hand coded (which you can do) but most are just presets.
when you are on your overview, just add a new widget clicking the (+) on the top right
For a live chart you can select "Detailed data", then select your source sensor, and the widget will appear, with the settings window open.
On the Display tab in this window you can select the type of display : numerical, bar graph, chart, gauge etc...
Then you have all the other tabs to customize your chart display to your heart's content
Discussions similaires
-
 English forum »
-
 Aquasuite 2017
(27 novembre 2016, 17:16)
Aquasuite 2017
(27 novembre 2016, 17:16)
-
- English forum »
-
Aquasuite 2012 + Open Hardware Monitor
(19 novembre 2011, 04:16)
-
- Überwachung und Steuerung »
-
Relaisfunktion seit FW 4.15a
(2 mars 2008, 11:52)
-
- Überwachung und Steuerung »
-
Aquasuite minimiert starten
(17 septembre 2007, 21:25)
-
- English forum »
-
lenguages software aquasuite
(4 février 2007, 20:46)
-