 18.04.2024, 12:14
 Sprache ändern
 Registrieren
 Anmelden
Sie sind nicht angemeldet.


This was timely, I was able to recover from a dumb mistake.
I went into the Data log > Analyze data tab to tweak my chart a bit.
Had intended to load the existing chart, but clicked on the save button by mistake, saving a blank chart over the existing chart.
So I shut down the aquasuite, recovered a previous copy of the database file from backup, copied it over the existing file, restarted the aquasuite & all is good.
I did not notice any thing detrimental from doing this and assume I only lost some recent data from the logger.
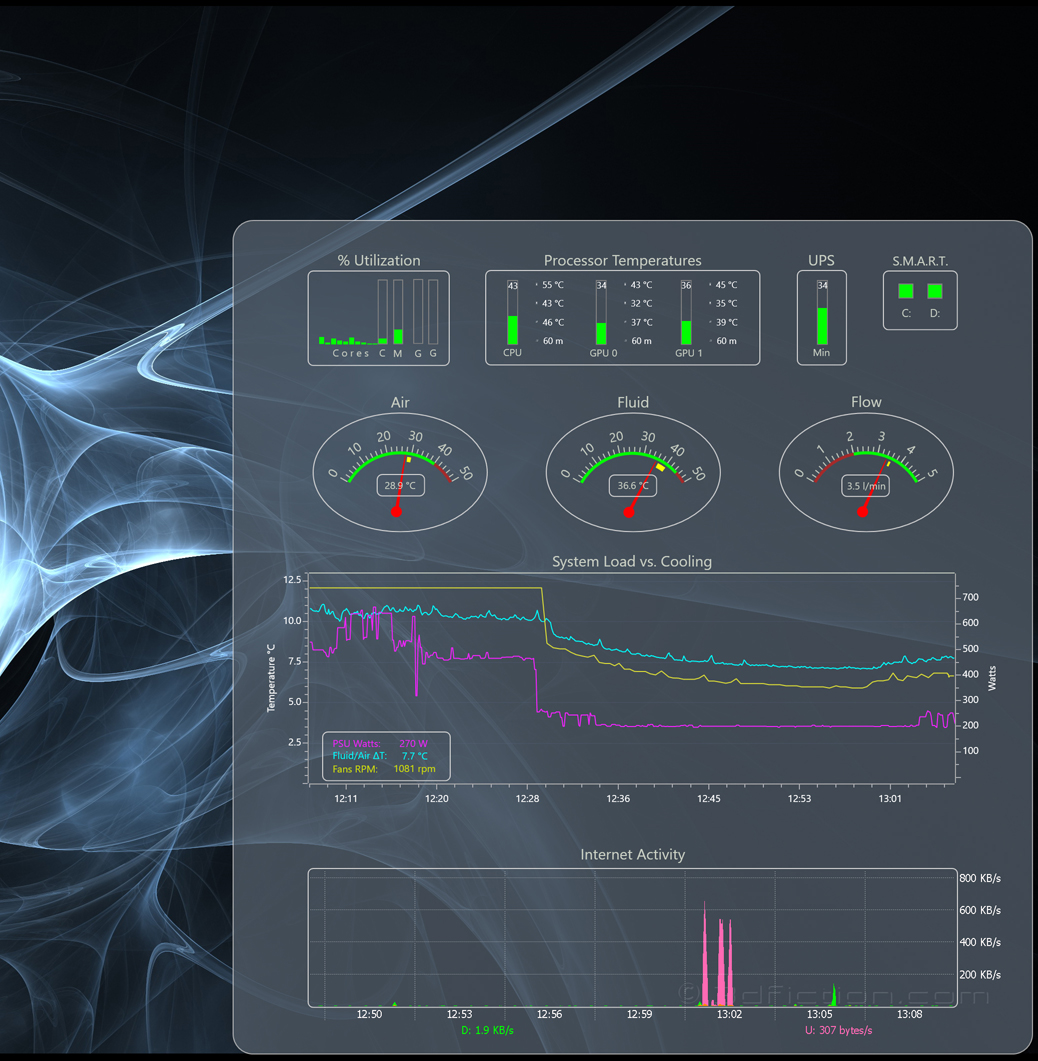
A SCREENSHOT of my secondary monitor showing the aquasuite panel.
I went into the Data log > Analyze data tab to tweak my chart a bit.
Had intended to load the existing chart, but clicked on the save button by mistake, saving a blank chart over the existing chart.
So I shut down the aquasuite, recovered a previous copy of the database file from backup, copied it over the existing file, restarted the aquasuite & all is good.
I did not notice any thing detrimental from doing this and assume I only lost some recent data from the logger.
A SCREENSHOT of my secondary monitor showing the aquasuite panel.
A SCREENSHOT of my secondary monitor showing the aquasuite panel.
Curious what software are you using for that display? Rainmeter? If so, is it easy to use? I try to stay away from apps that involve lots of programming, etc. I'm looking for the easy way out and love the way Rainmeter funtions with lots of options. I believe I've seen amazing looking desktop backgrounds that were basically the health of the whole system including one's loop and AC's hardware.
I think I am finished with my aquasuite panel for the moment.
I am not able to set the gauges as desired, but overall I am pleased with the result.
I would prefer the unit & source text be removable, then I would place the value on the gauge & the source below it
I also would like to be able to control the font size of the numbers around the arch of the gauge
It may not be a big deal, but I know engineers can be picky about accuracy.
The algorithm for the gauge needle display is slightly below value.
The "Air" value is 29,1 but the gauge shows 27,9
The "Fluid" value is 37,3 but the gauge shows 36
The "Flow" value is 3,6 but the gauge shows 3,4
Around a 4% error.
Screenshot of my second/support monitor:
Dieser Beitrag wurde bereits 1 mal editiert, zuletzt von »InfoSeeker« (12. September 2018, 02:49)

Thank you... I had tried zero, which did not work, but did not think to try a decimal number.hello chosen your comment, if in the size of the text puts 0.1, it disappears completely.
True, hopefully the software engineers have some time to address the display issues with the gauge object.
Zitat
¿But the size of the dial numbers can not be fixed the size?
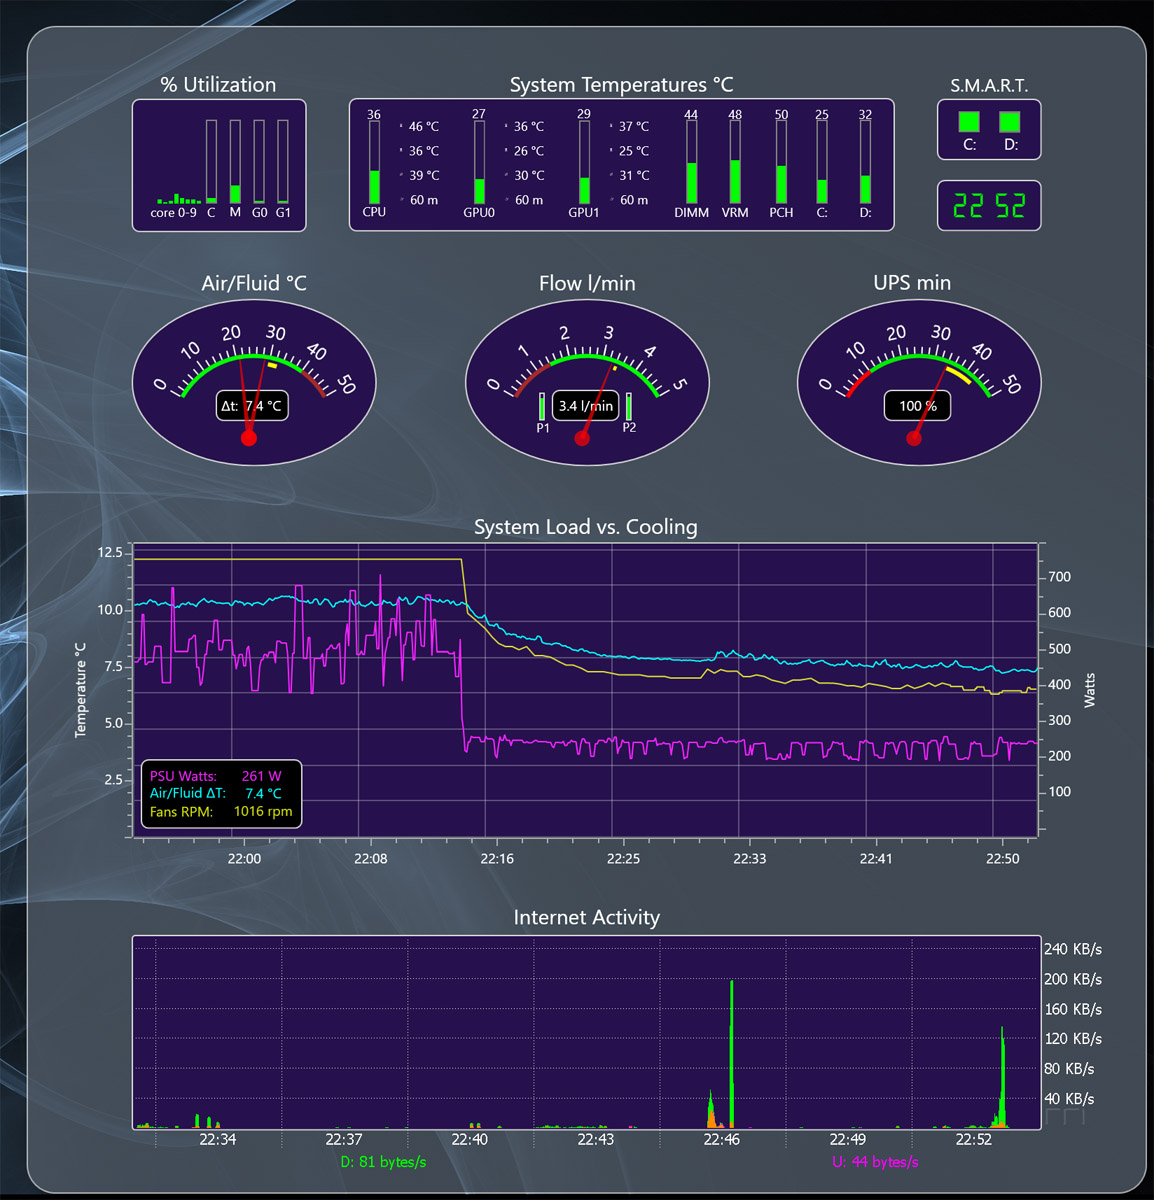
Your panel motivated me to add some color using the "Fill" command.

Thank you... I had tried zero, which did not work, but did not think to try a decimal number.hello chosen your comment, if in the size of the text puts 0.1, it disappears completely.
True, hopefully the software engineers have some time to address the display issues with the gauge object.
¿But the size of the dial numbers can not be fixed the size?
Your panel motivated me to add some color using the "Fill" command.
hello if you want to visualize the design, here you have on You tube,
regards

https://youtu.be/GablkZKBmr8

OK, I see my problem, I need to learn XAML.
I looked in the dot.page file and found StatisticHeight settings set to 5.
The only issue then was finding which ones addressed the 3 gauge objects I display, and change to 3.
Got it done, but will be easier once I learn the structure and syntax.
I may even be able to change the font size of the numbers on the gauge arc.
Ähnliche Themen
-
 English forum »
-
 humble request
(8. September 2016, 14:40)
humble request
(8. September 2016, 14:40)
-
- English forum »
-
aquasuite 2016-4
(28. Januar 2016, 15:34)
-
- English forum »
-
Log Data save
(4. Januar 2016, 21:58)
-
- English forum »
-
Aquasuite - Here are my settings - What are yours ?
(27. Juni 2013, 17:52)
-
- English forum »
-
Questions for experienced Aquaero users on temp sensor inputs
(22. März 2013, 13:23)
-