• 21.08.2025, 15:03
  • Registrieren
  • Anmelden
  • Sie sind nicht angemeldet.


InfoSeeker

Senior Member

Data Log question

Donnerstag, 14. Mai 2015, 00:48

Well, this is embarrassing, but I need help find the entry point to create a Data Log. The manual states:

Zitat

10.1. Log settings
The log settings can be accessed by clicking the “Log settings” element below
the “Data log” headline in the listing.

But the only "Data Log" I see is a tab under the aquaero in aquasuite, and it does not accurately reflect the options discussed in the manual.

Railgun

Full Member

Donnerstag, 14. Mai 2015, 11:27

You don't have this section in Aquasuite? It should be there and I'm not aware of any way to remove it, or add it if not there.

Dieser Beitrag wurde bereits 1 mal editiert, zuletzt von »Railgun« (14. Mai 2015, 11:29)

Jakusonfire

Full Member

Donnerstag, 14. Mai 2015, 12:30

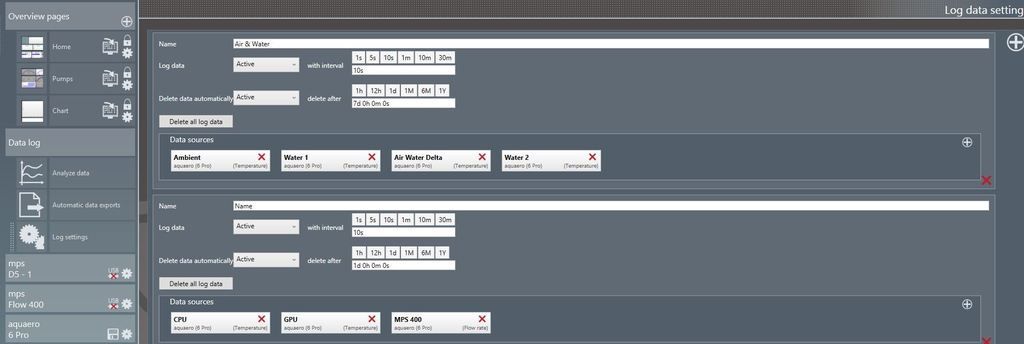
First go to log Settings and add some data sources that you want to use.


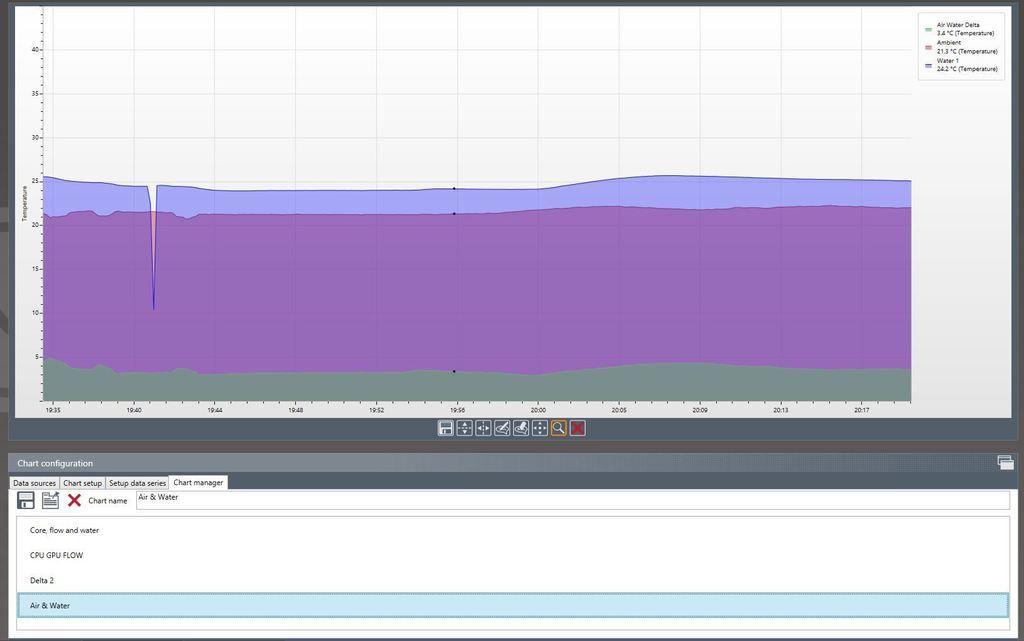
Add the Data Sources to a chart


Save the chart for use in an overview page

Dieser Beitrag wurde bereits 1 mal editiert, zuletzt von »Jakusonfire« (14. Mai 2015, 12:32)

InfoSeeker

Senior Member

Donnerstag, 14. Mai 2015, 20:17

Wow, talk about Major Brain Fart... I got locked on the Data Log tab under the aquaero and didn't see the primary one I needed. I'll ask later what the aquaero Data Log is used for.

OK, I set up a data set, made the chart the way I wanted, saved the chart and am able to pick it up on the Display Page.


Only thing is, when I closed the edit function of the display page to set it on the desktop, the data log graph is not there.


I know it must be something simple, but am not able to determine my error.

Edit, by the by, thank you both very much for your help.

Dieser Beitrag wurde bereits 1 mal editiert, zuletzt von »InfoSeeker« (14. Mai 2015, 20:19)

InfoSeeker

Senior Member

Samstag, 16. Mai 2015, 15:13

Well, I re-installed aquasuite as repair, and that did not fix the issue, but a re-install as new did.

InfoSeeker

Senior Member

Samstag, 16. Mai 2015, 23:06

OK, moving on... I am trying to have the Data Log display show 15 minutes of data to match the rest of the elements, but am able to show only a 30 minute window. Is this the only Time Frame available?


I set the Time Frame to 15m in the Data Sources tab of the Chart Configuration section to no avail.

InfoSeeker

Senior Member

Sonntag, 17. Mai 2015, 04:05

mhmm, it appears one has to set the Time Range prior to adding the data to the chart... looks like it is not changeable once the chart is started.